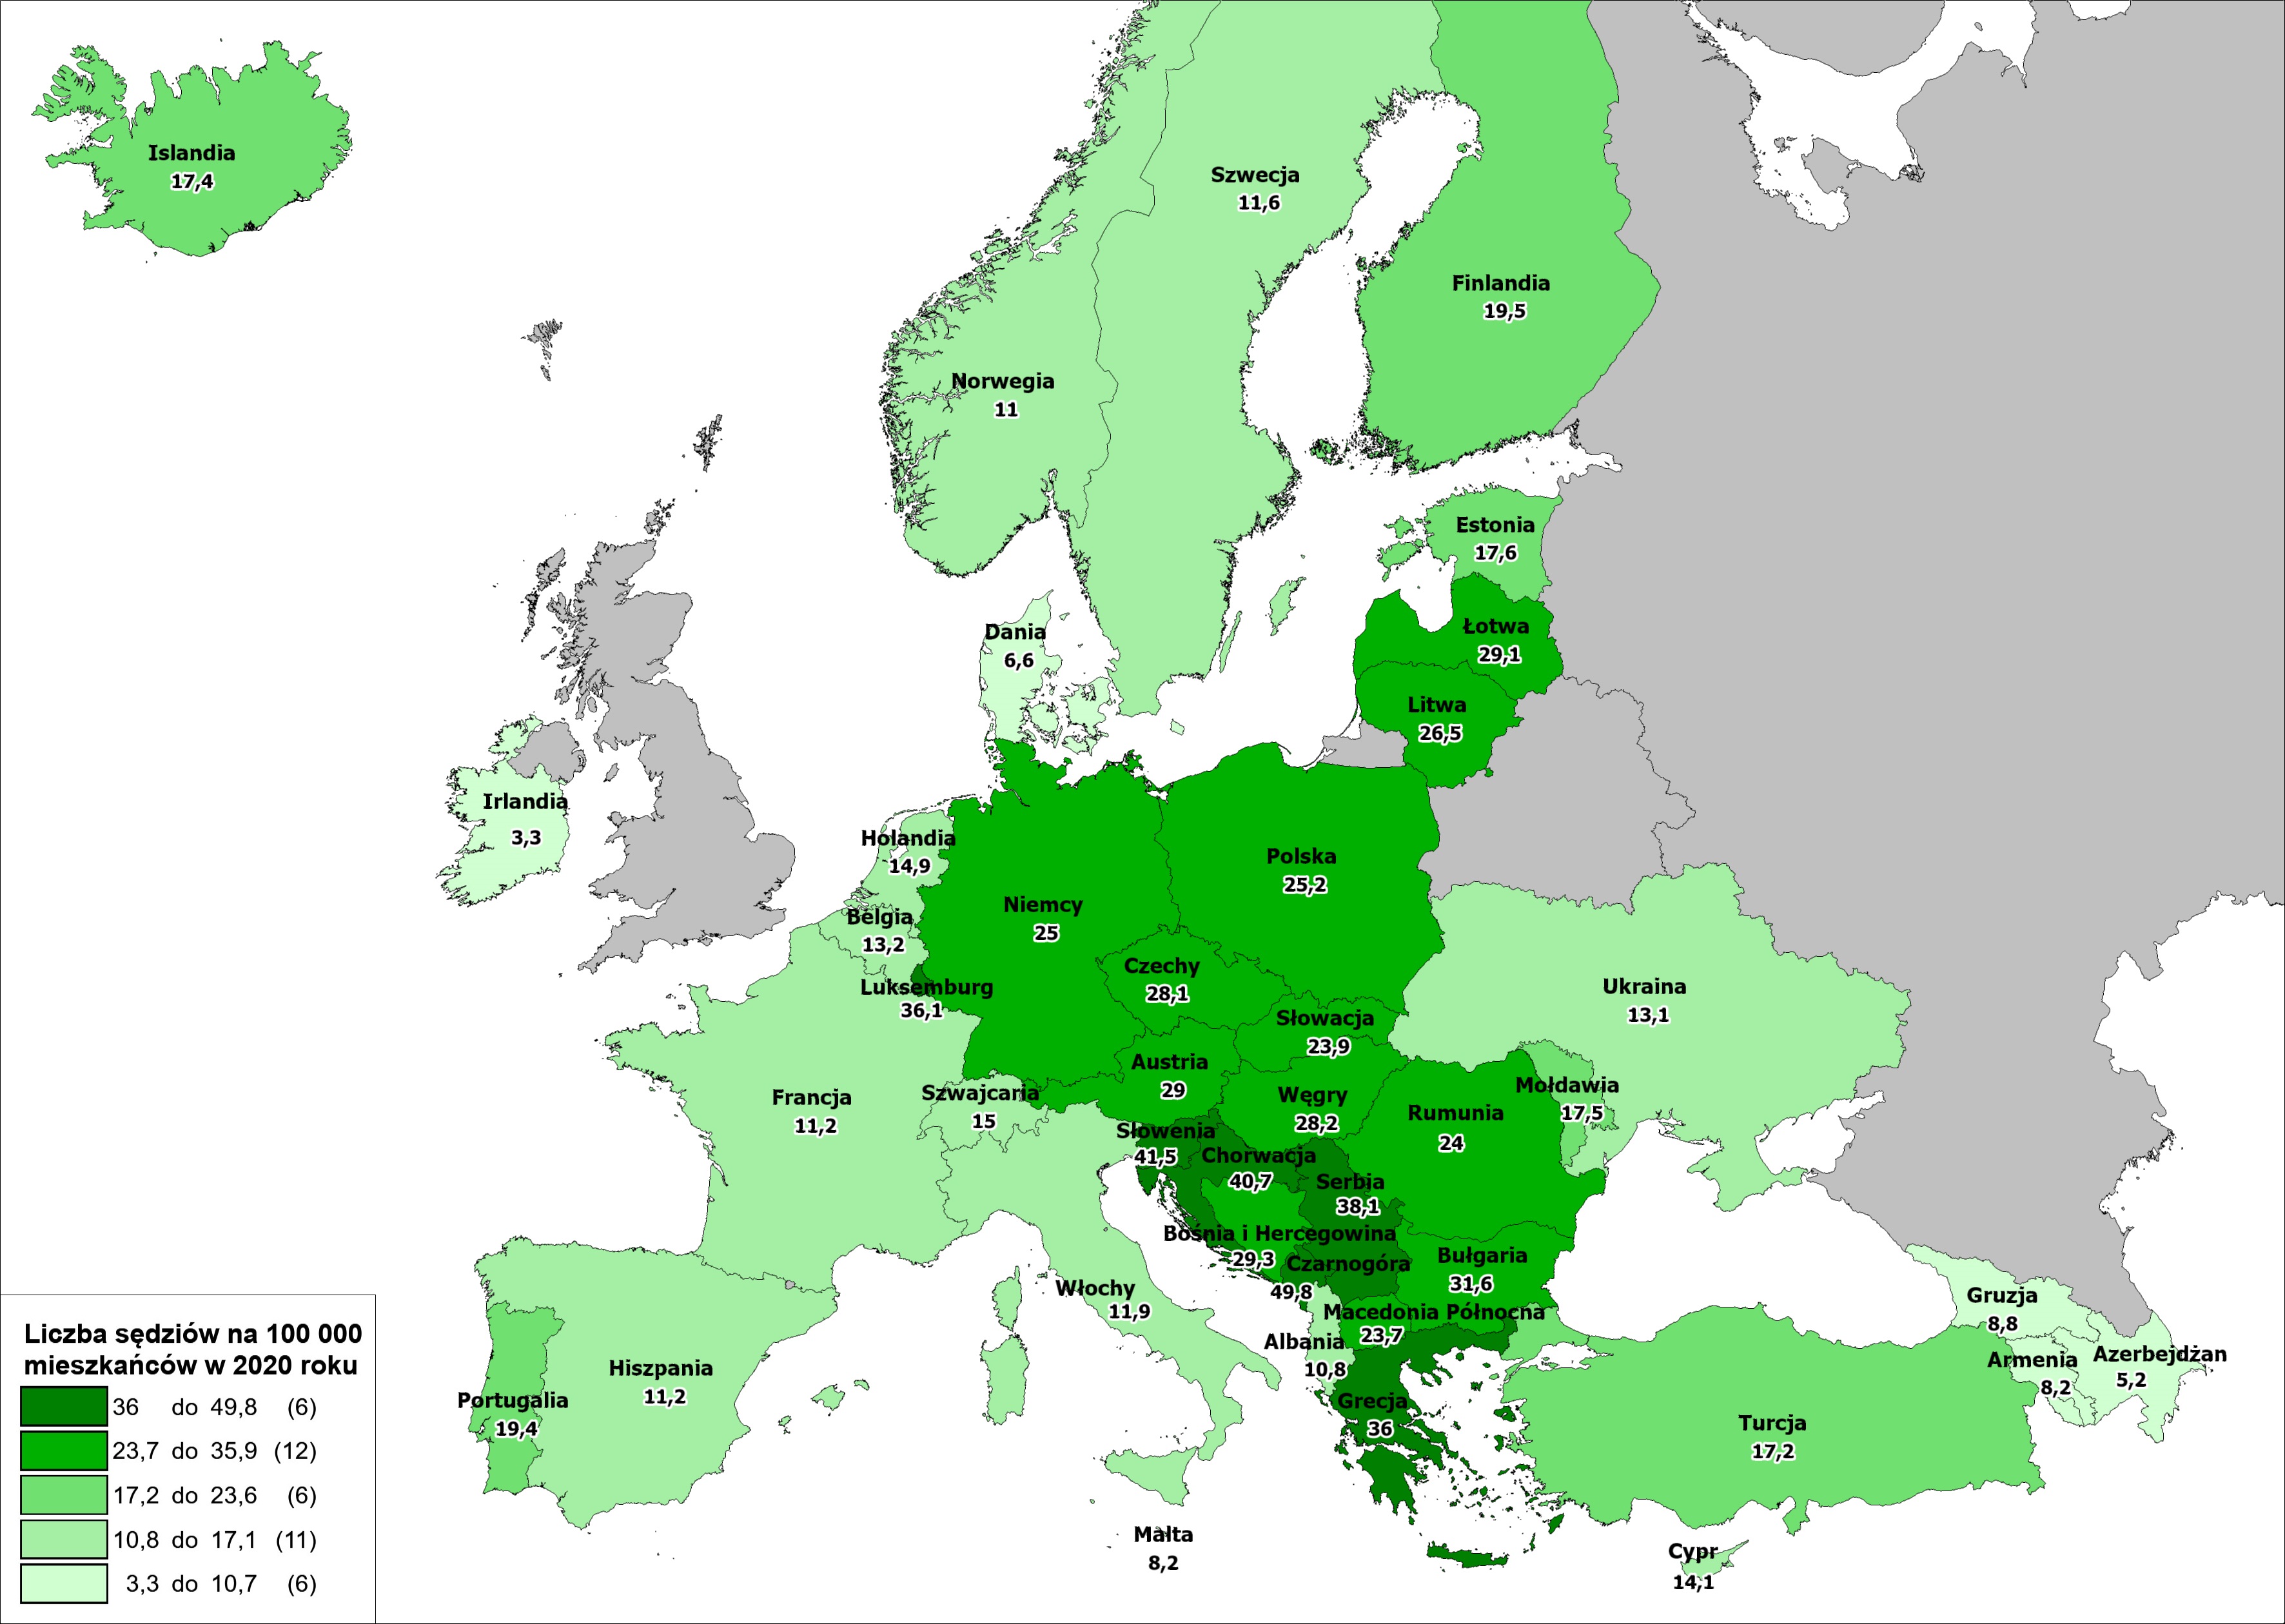
Źródło: „European judicial systems - CEPEJ Evaluation Report – 2022 Evaluation cycle (2020 data)”, The CEPEJ-STAT dynamic database: https://www.coe.int/en/web/cepej/cepej-stat, Number of professional judges per 100 000 inhabitants in 2020 (Q1, Q46)
![]()
Źródło: „European judicial systems - CEPEJ Evaluation Report – 2022 Evaluation cycle (2020 data)”, The CEPEJ-STAT dynamic database: https://www.coe.int/en/web/cepej/cepej-stat, Clearance rate in Civil (and commercial) litigious cases (1st inst.) in 2020 (Q91)
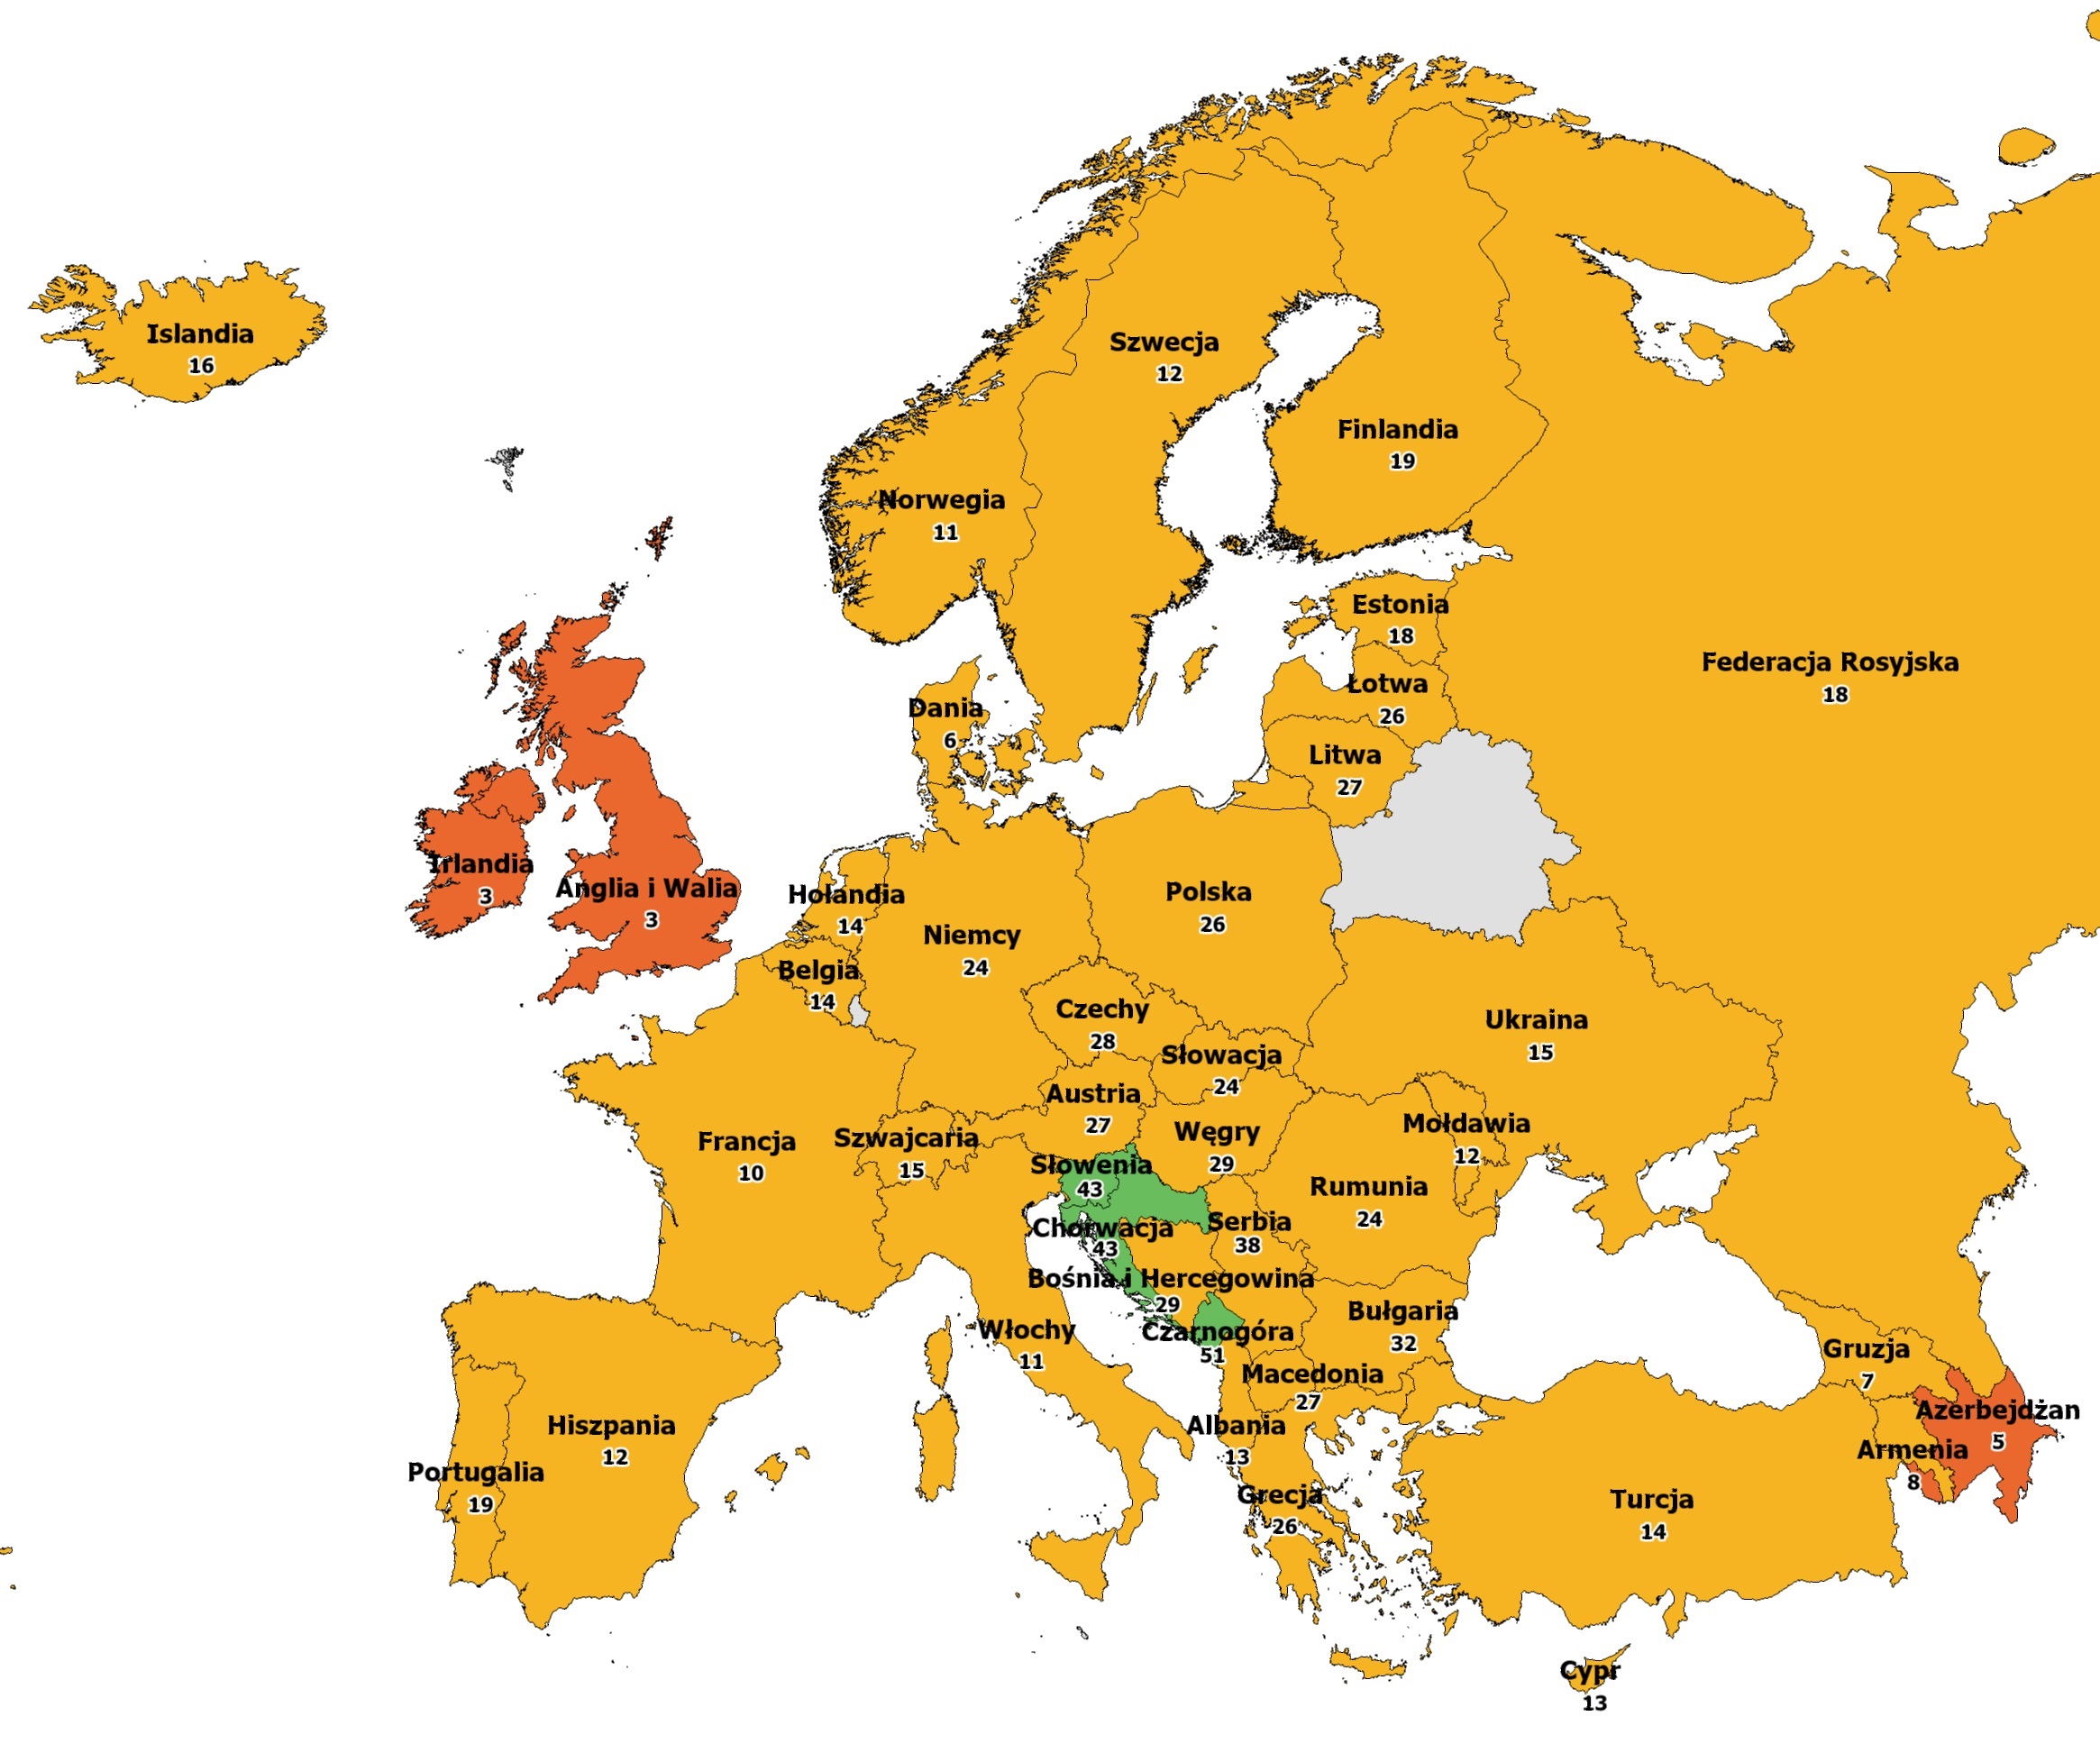
Źródło: CEPEJ Report on "European judicial systems - Edition 2018 (2016 data): efficiency and quality of justice" - Table 7.1 Number of professional judges per 100 000 inhabitants in 2016
| Pozycja | Kraj | Wartość |
| 1 | Czarnogóra | 51 |
| 2 | Chorwacja | 43 |
| 3 | Słowenia | 43 |
| 4 | Serbia | 38 |
| 5 | Bułgaria | 32 |
| 6 | Bośnia i Hercegowina | 29 |
| 7 | Węgry | 29 |
| 8 | Czechy | 28 |
| 9 | Austria | 27 |
| 10 | Litwa | 27 |
| 11 | Macedonia | 27 |
| 12 | Grecja | 26 |
| 13 | Łotwa | 26 |
| 14 | Polska | 26 |
| 15 | Niemcy | 24 |
| 16 | Rumunia | 24 |
| 17 | Słowacja | 24 |
| 18 | Finlandia | 19 |
| 19 | Portugalia | 19 |
| 20 | Estonia | 18 |
| 21 | Federacja Rosyjska | 18 |
| 22 | Islandia | 16 |
| 23 | Szwajcaria | 15 |
| 24 | Ukraina | 15 |
| 25 | Belgia | 14 |
| 26 | Holandia | 14 |
| 27 | Turcja | 14 |
| 28 | Albania | 13 |
| 29 | Cypr | 13 |
| 30 | Mołdawia | 12 |
| 31 | Hiszpania | 12 |
| 32 | Szwecja | 12 |
| 33 | Włochy | 11 |
| 34 | Norwegia | 11 |
| 35 | Francja | 10 |
| 36 | Armenia | 8 |
| 37 | Gruzja | 7 |
| 38 | Dania | 6 |
| 39 | Azerbejdżan | 5 |
| 40 | Irlandia | 3 |
| 41 | Anglia i Walia | 3 |
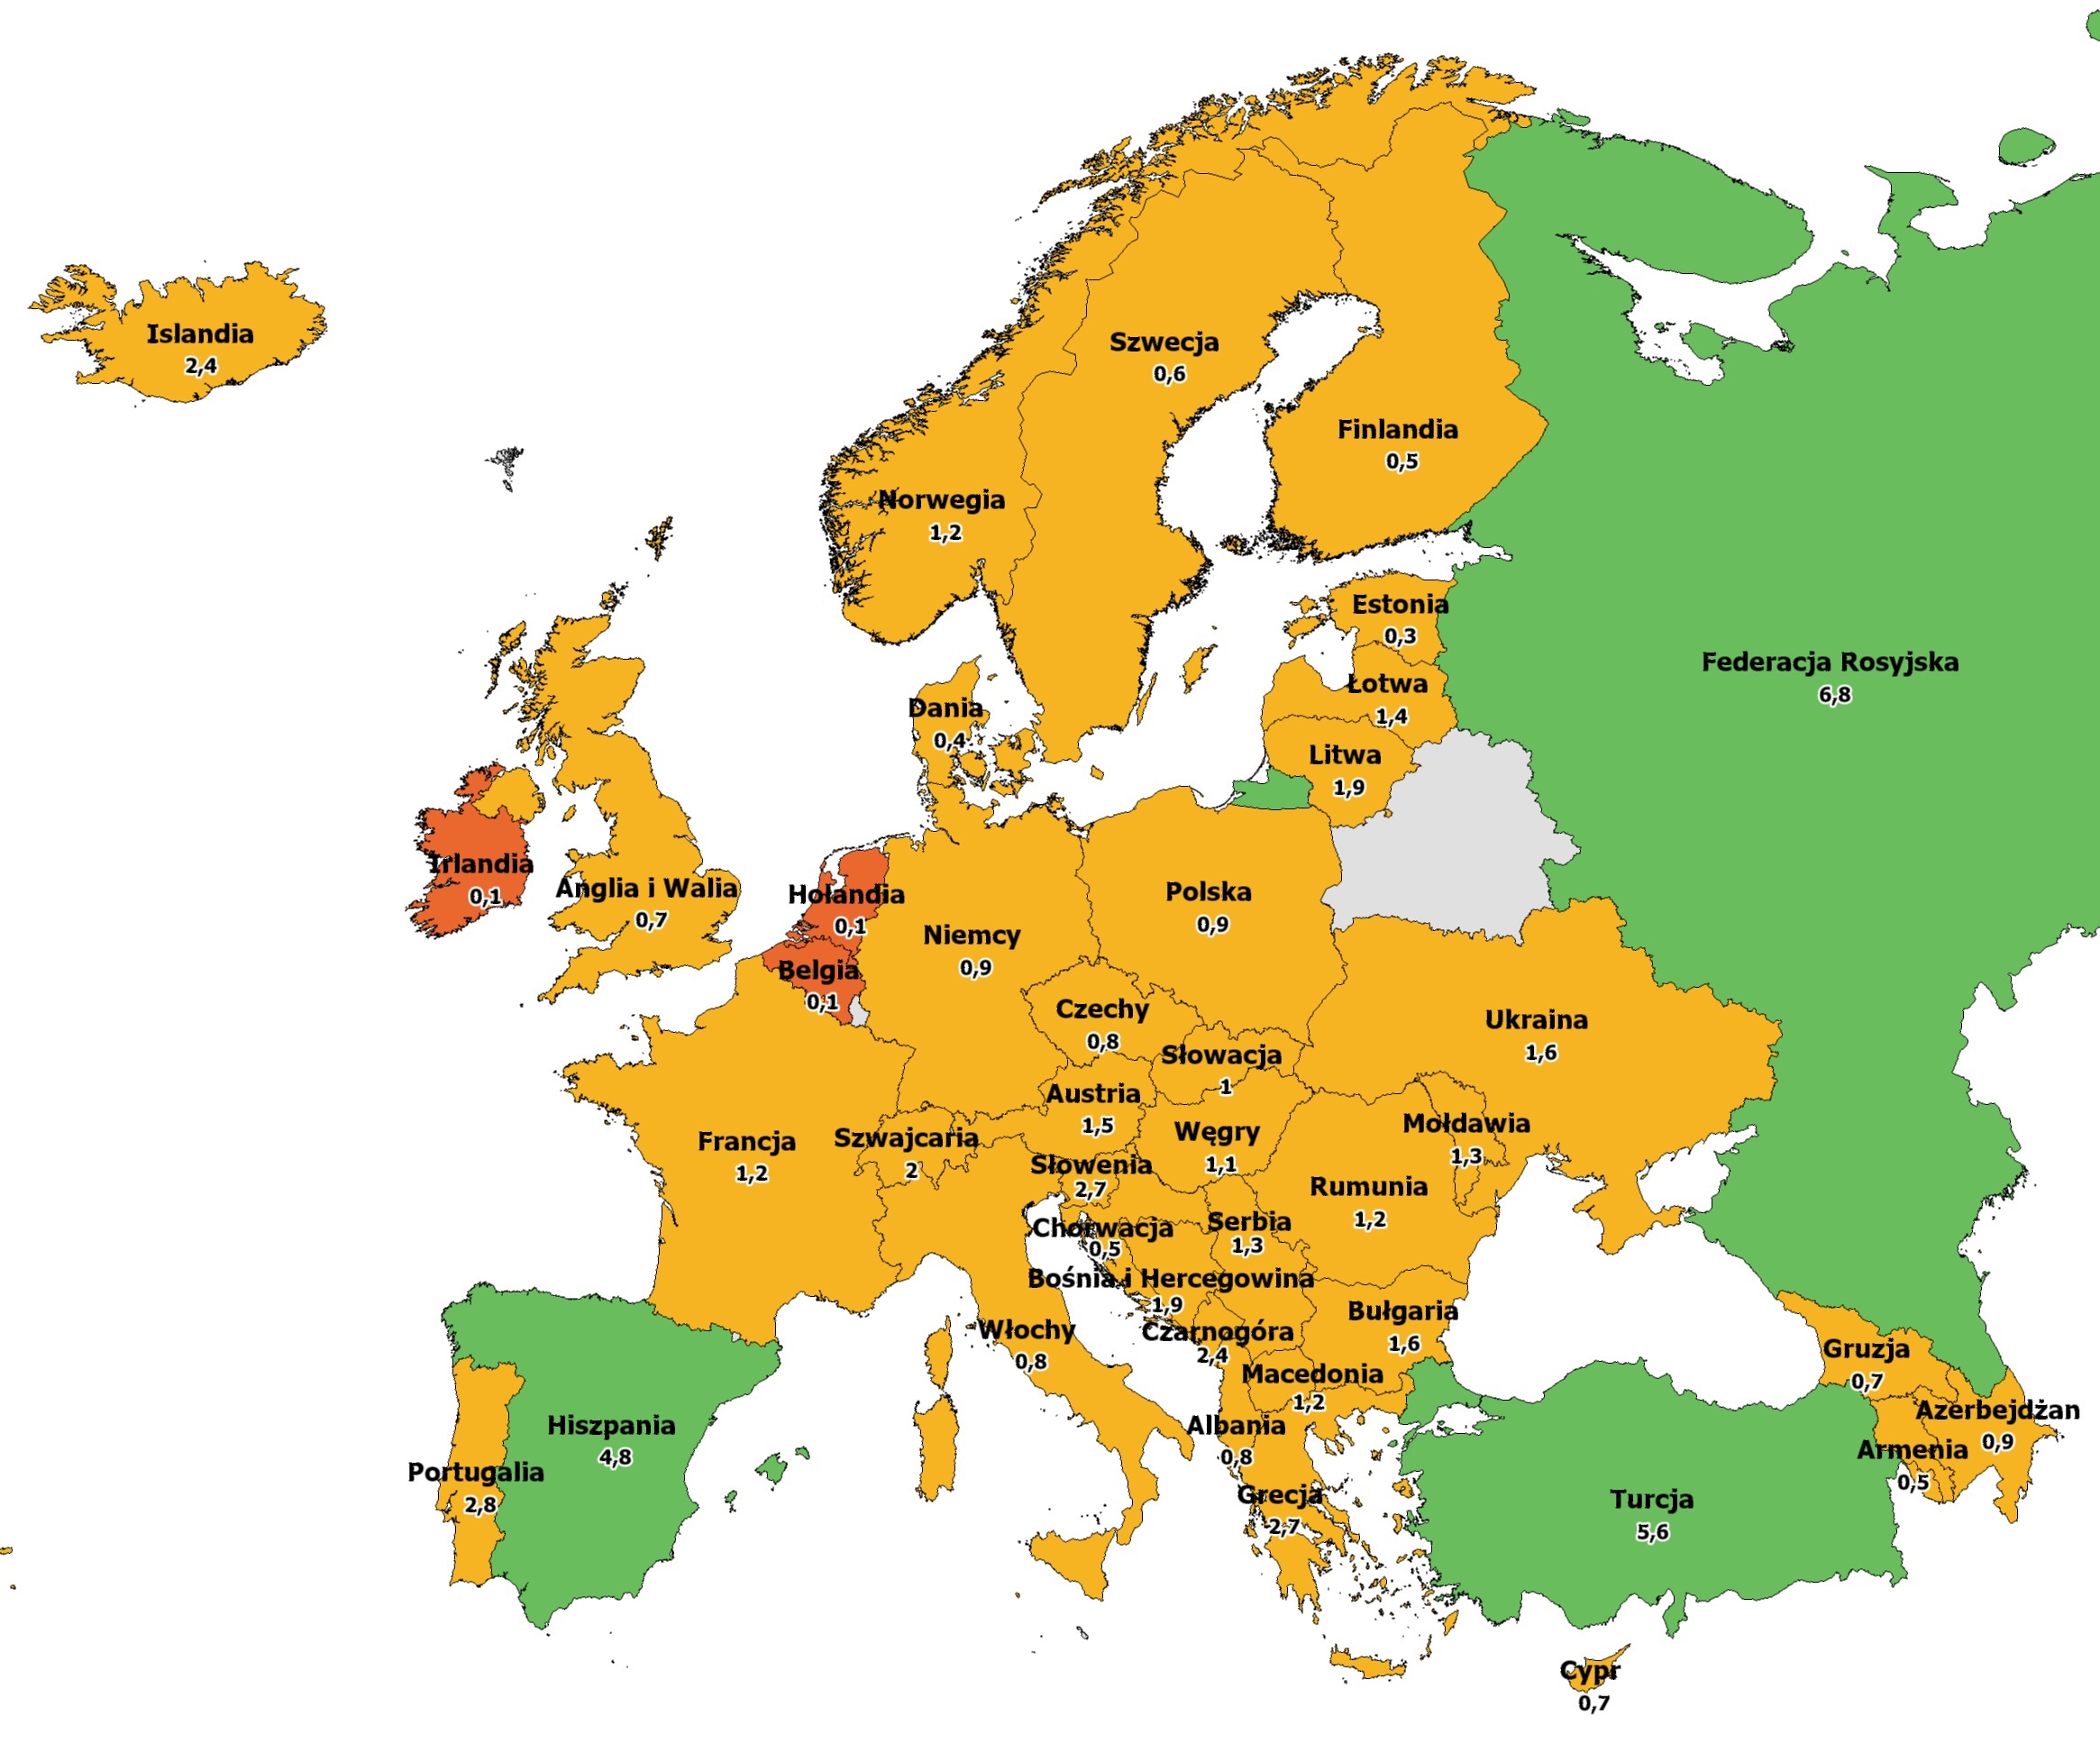
Źródło: CEPEJ Report on "European judicial systems - Edition 2018 (2016 data): efficiency and quality of justice" - Table 5.1 Total number of 1st instance courts per 100 000 inhabitants in 2016
| Pozycja | Kraj | Wartość |
| 1 | Federacja Rosyjska | 6,8 |
| 2 | Turcja | 5,6 |
| 3 | Hiszpania | 4,8 |
| 4 | Portugalia | 2,8 |
| 5 | Grecja | 2,7 |
| 6 | Słowenia | 2,7 |
| 7 | Islandia | 2,4 |
| 8 | Czarnogóra | 2,4 |
| 9 | Szwajcaria | 2,0 |
| 10 | Bośnia i Hercegowina | 1,9 |
| 11 | Litwa | 1,9 |
| 12 | Bułgaria | 1,6 |
| 13 | Ukraina | 1,6 |
| 14 | Austria | 1,5 |
| 15 | Łotwa | 1,4 |
| 16 | Mołdawia | 1,3 |
| 17 | Serbia | 1,3 |
| 18 | Francja | 1,2 |
| 19 | Norwegia | 1,2 |
| 20 | Rumunia | 1,2 |
| 21 | Macedonia | 1,2 |
| 22 | Węgry | 1,1 |
| 23 | Słowacja | 1,0 |
| 24 | Azerbejdżan | 0,9 |
| 25 | Niemcy | 0,9 |
| 26 | Polska | 0,9 |
| 27 | Albania | 0,8 |
| 28 | Czechy | 0,8 |
| 29 | Włochy | 0,8 |
| 30 | Cypr | 0,7 |
| 31 | Gruzja | 0,7 |
| 32 | Anglia i Walia | 0,7 |
| 33 | Szwecja | 0,6 |
| 34 | Armenia | 0,5 |
| 35 | Chorwacja | 0,5 |
| 36 | Finlandia | 0,5 |
| 37 | Dania | 0,4 |
| 38 | Estonia | 0,3 |
| 39 | Belgia | 0,1 |
| 40 | Irlandia | 0,1 |
| 41 | Holandia | 0,1 |
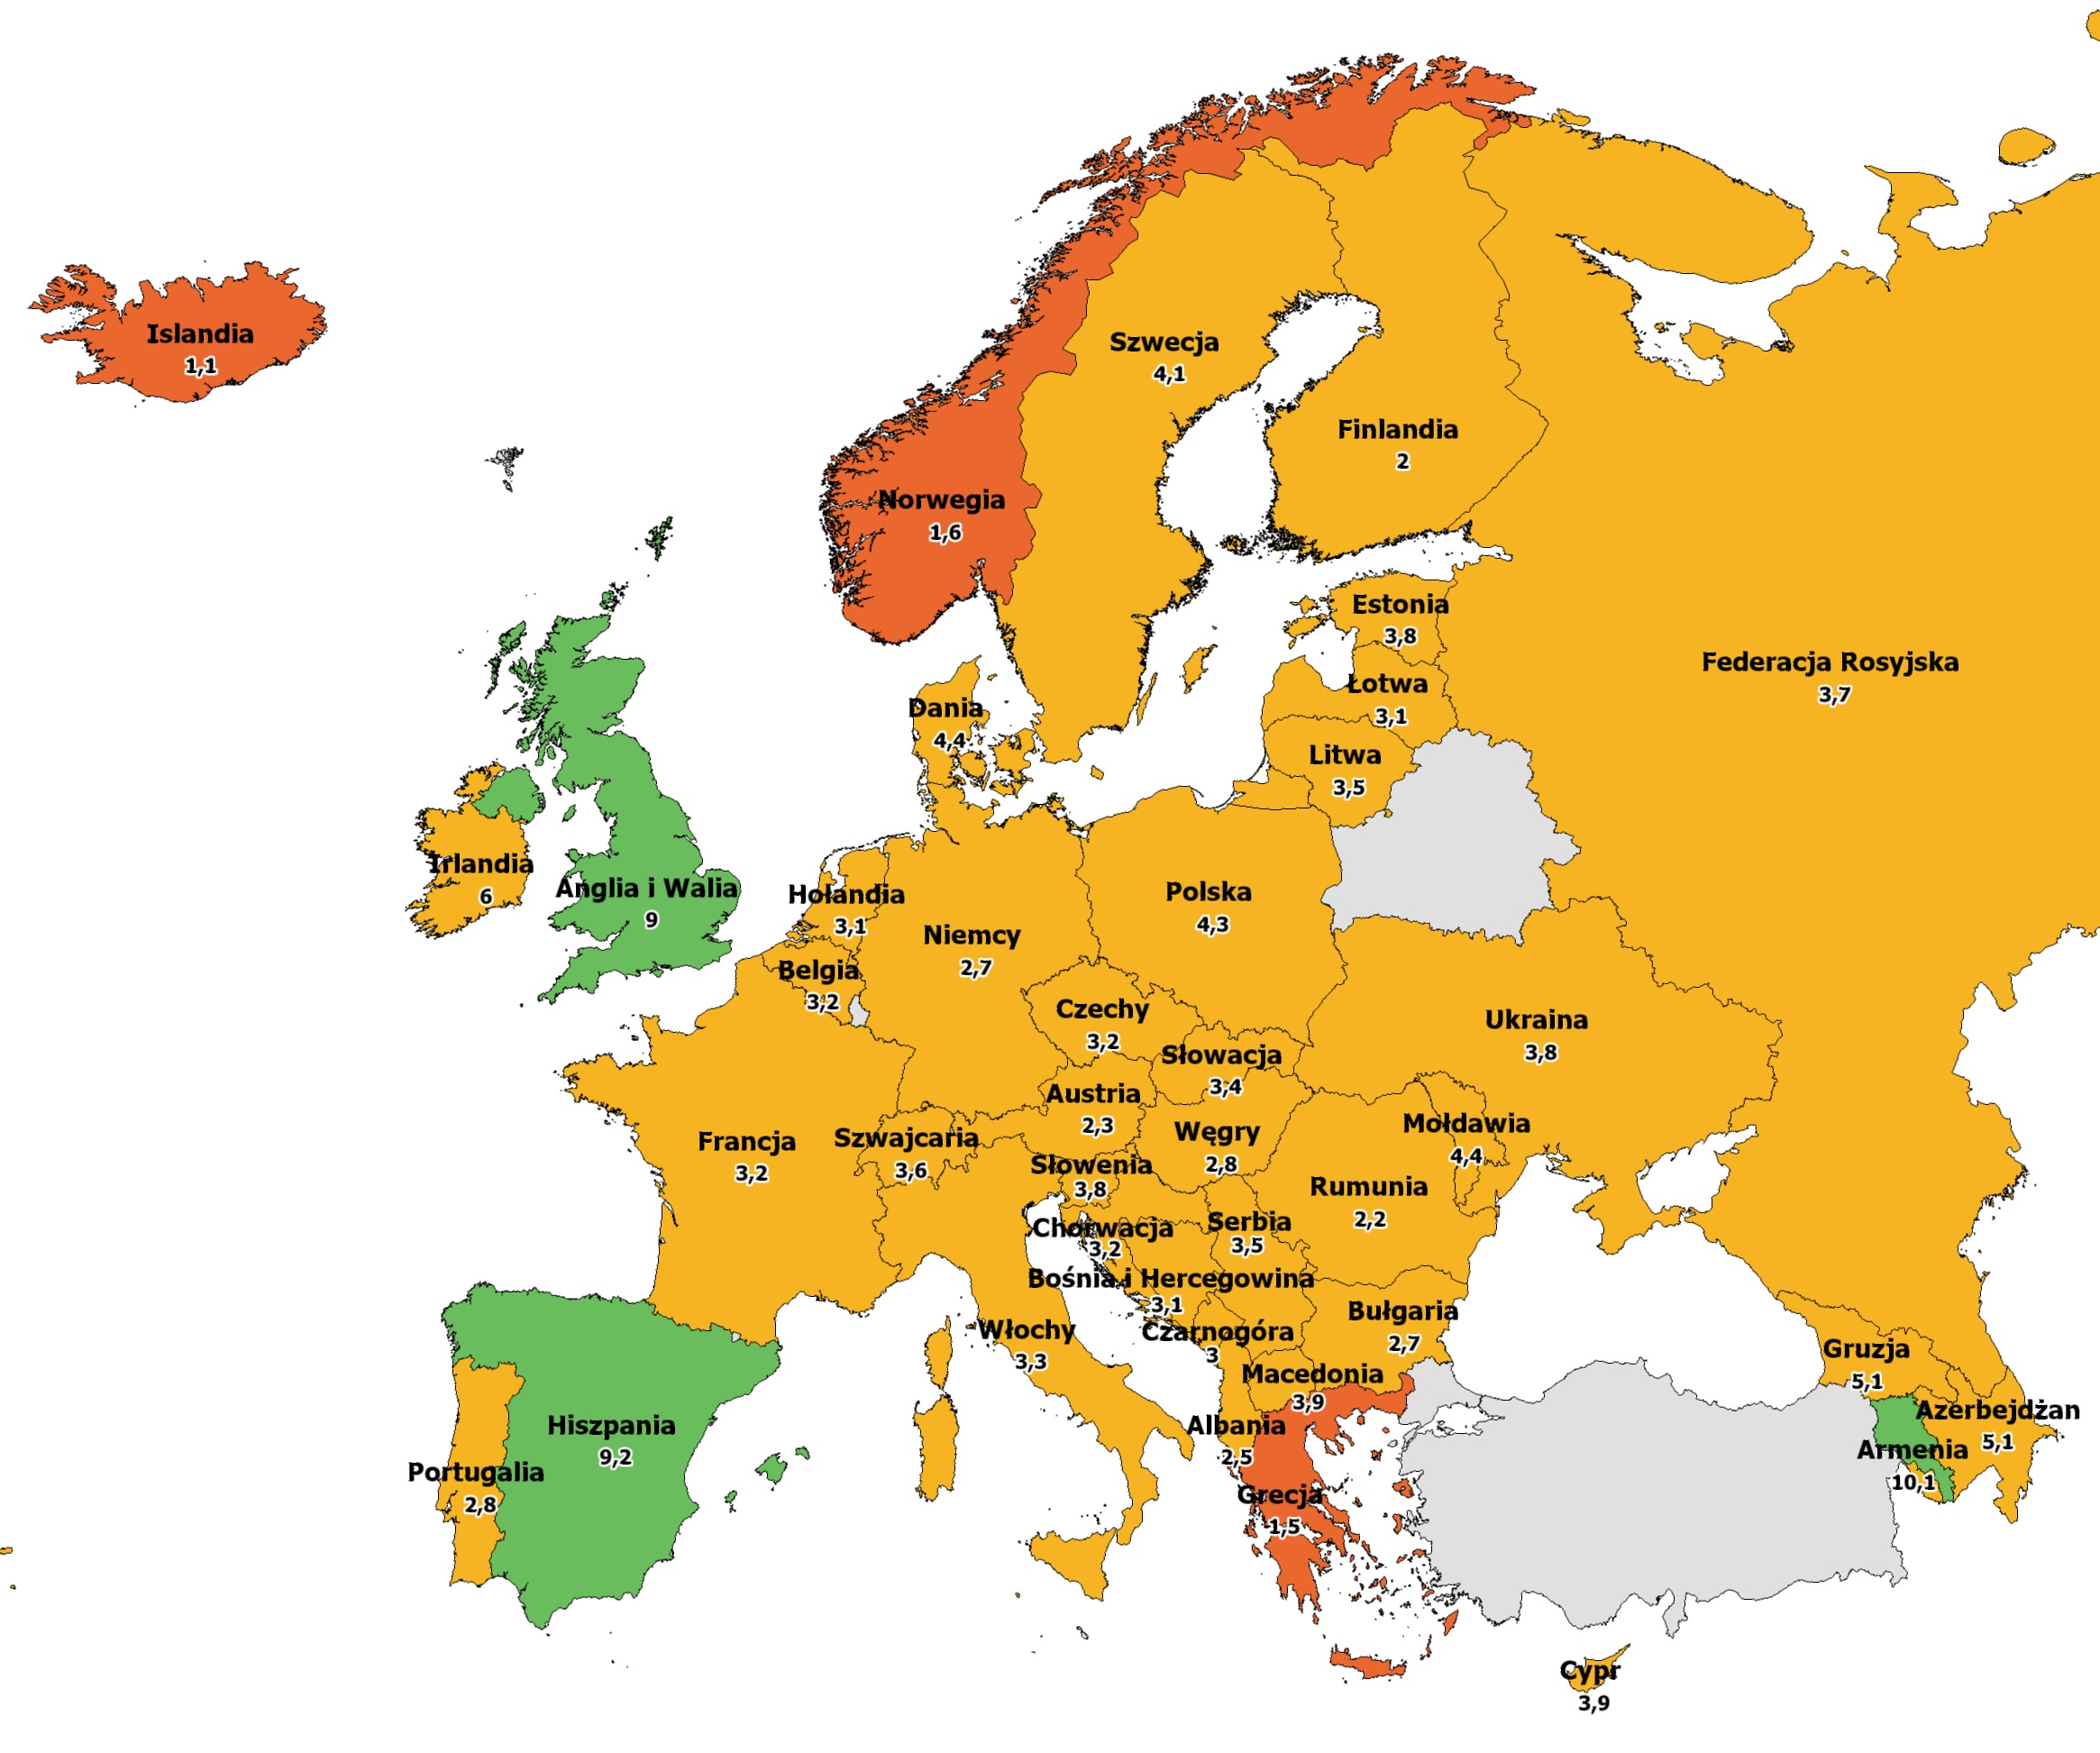
Źródło: CEPEJ Report on "European judicial systems - Edition 2018 (2016 data): efficiency and quality of justice" - Figure 8.4 Number of non-judge staff whose task is to assist the judge per one professional judge in 2016
| Pozycja | Kraj | Wartość |
| 1 | Armenia | 10,1 |
| 2 | Hiszpania | 9,2 |
| 3 | Anglia i Walia | 9,0 |
| 4 | Irlandia | 6,0 |
| 5 | Azerbejdżan | 5,1 |
| 6 | Gruzja | 5,1 |
| 7 | Dania | 4,4 |
| 8 | Mołdawia | 4,4 |
| 9 | Polska | 4,3 |
| 10 | Szwecja | 4,1 |
| 11 | Cypr | 3,9 |
| 12 | Macedonia | 3,9 |
| 13 | Estonia | 3,8 |
| 14 | Słowenia | 3,8 |
| 15 | Ukraina | 3,8 |
| 16 | Federacja Rosyjska | 3,7 |
| 17 | Szwajcaria | 3,6 |
| 18 | Litwa | 3,5 |
| 19 | Serbia | 3,5 |
| 20 | Słowacja | 3,4 |
| 21 | Włochy | 3,3 |
| 22 | Belgia | 3,2 |
| 23 | Chorwacja | 3,2 |
| 24 | Czechy | 3,2 |
| 25 | Francja | 3,2 |
| 26 | Bośnia i Hercegowina | 3,1 |
| 27 | Łotwa | 3,1 |
| 28 | Holandia | 3,1 |
| 29 | Czarnogóra | 3,0 |
| 30 | Węgry | 2,8 |
| 31 | Portugalia | 2,8 |
| 32 | Bułgaria | 2,7 |
| 33 | Niemcy | 2,7 |
| 34 | Albania | 2,5 |
| 35 | Austria | 2,3 |
| 36 | Rumunia | 2,2 |
| 37 | Finlandia | 2,0 |
| 38 | Norwegia | 1,6 |
| 39 | Grecja | 1,5 |
| 40 | Islandia | 1,1 |
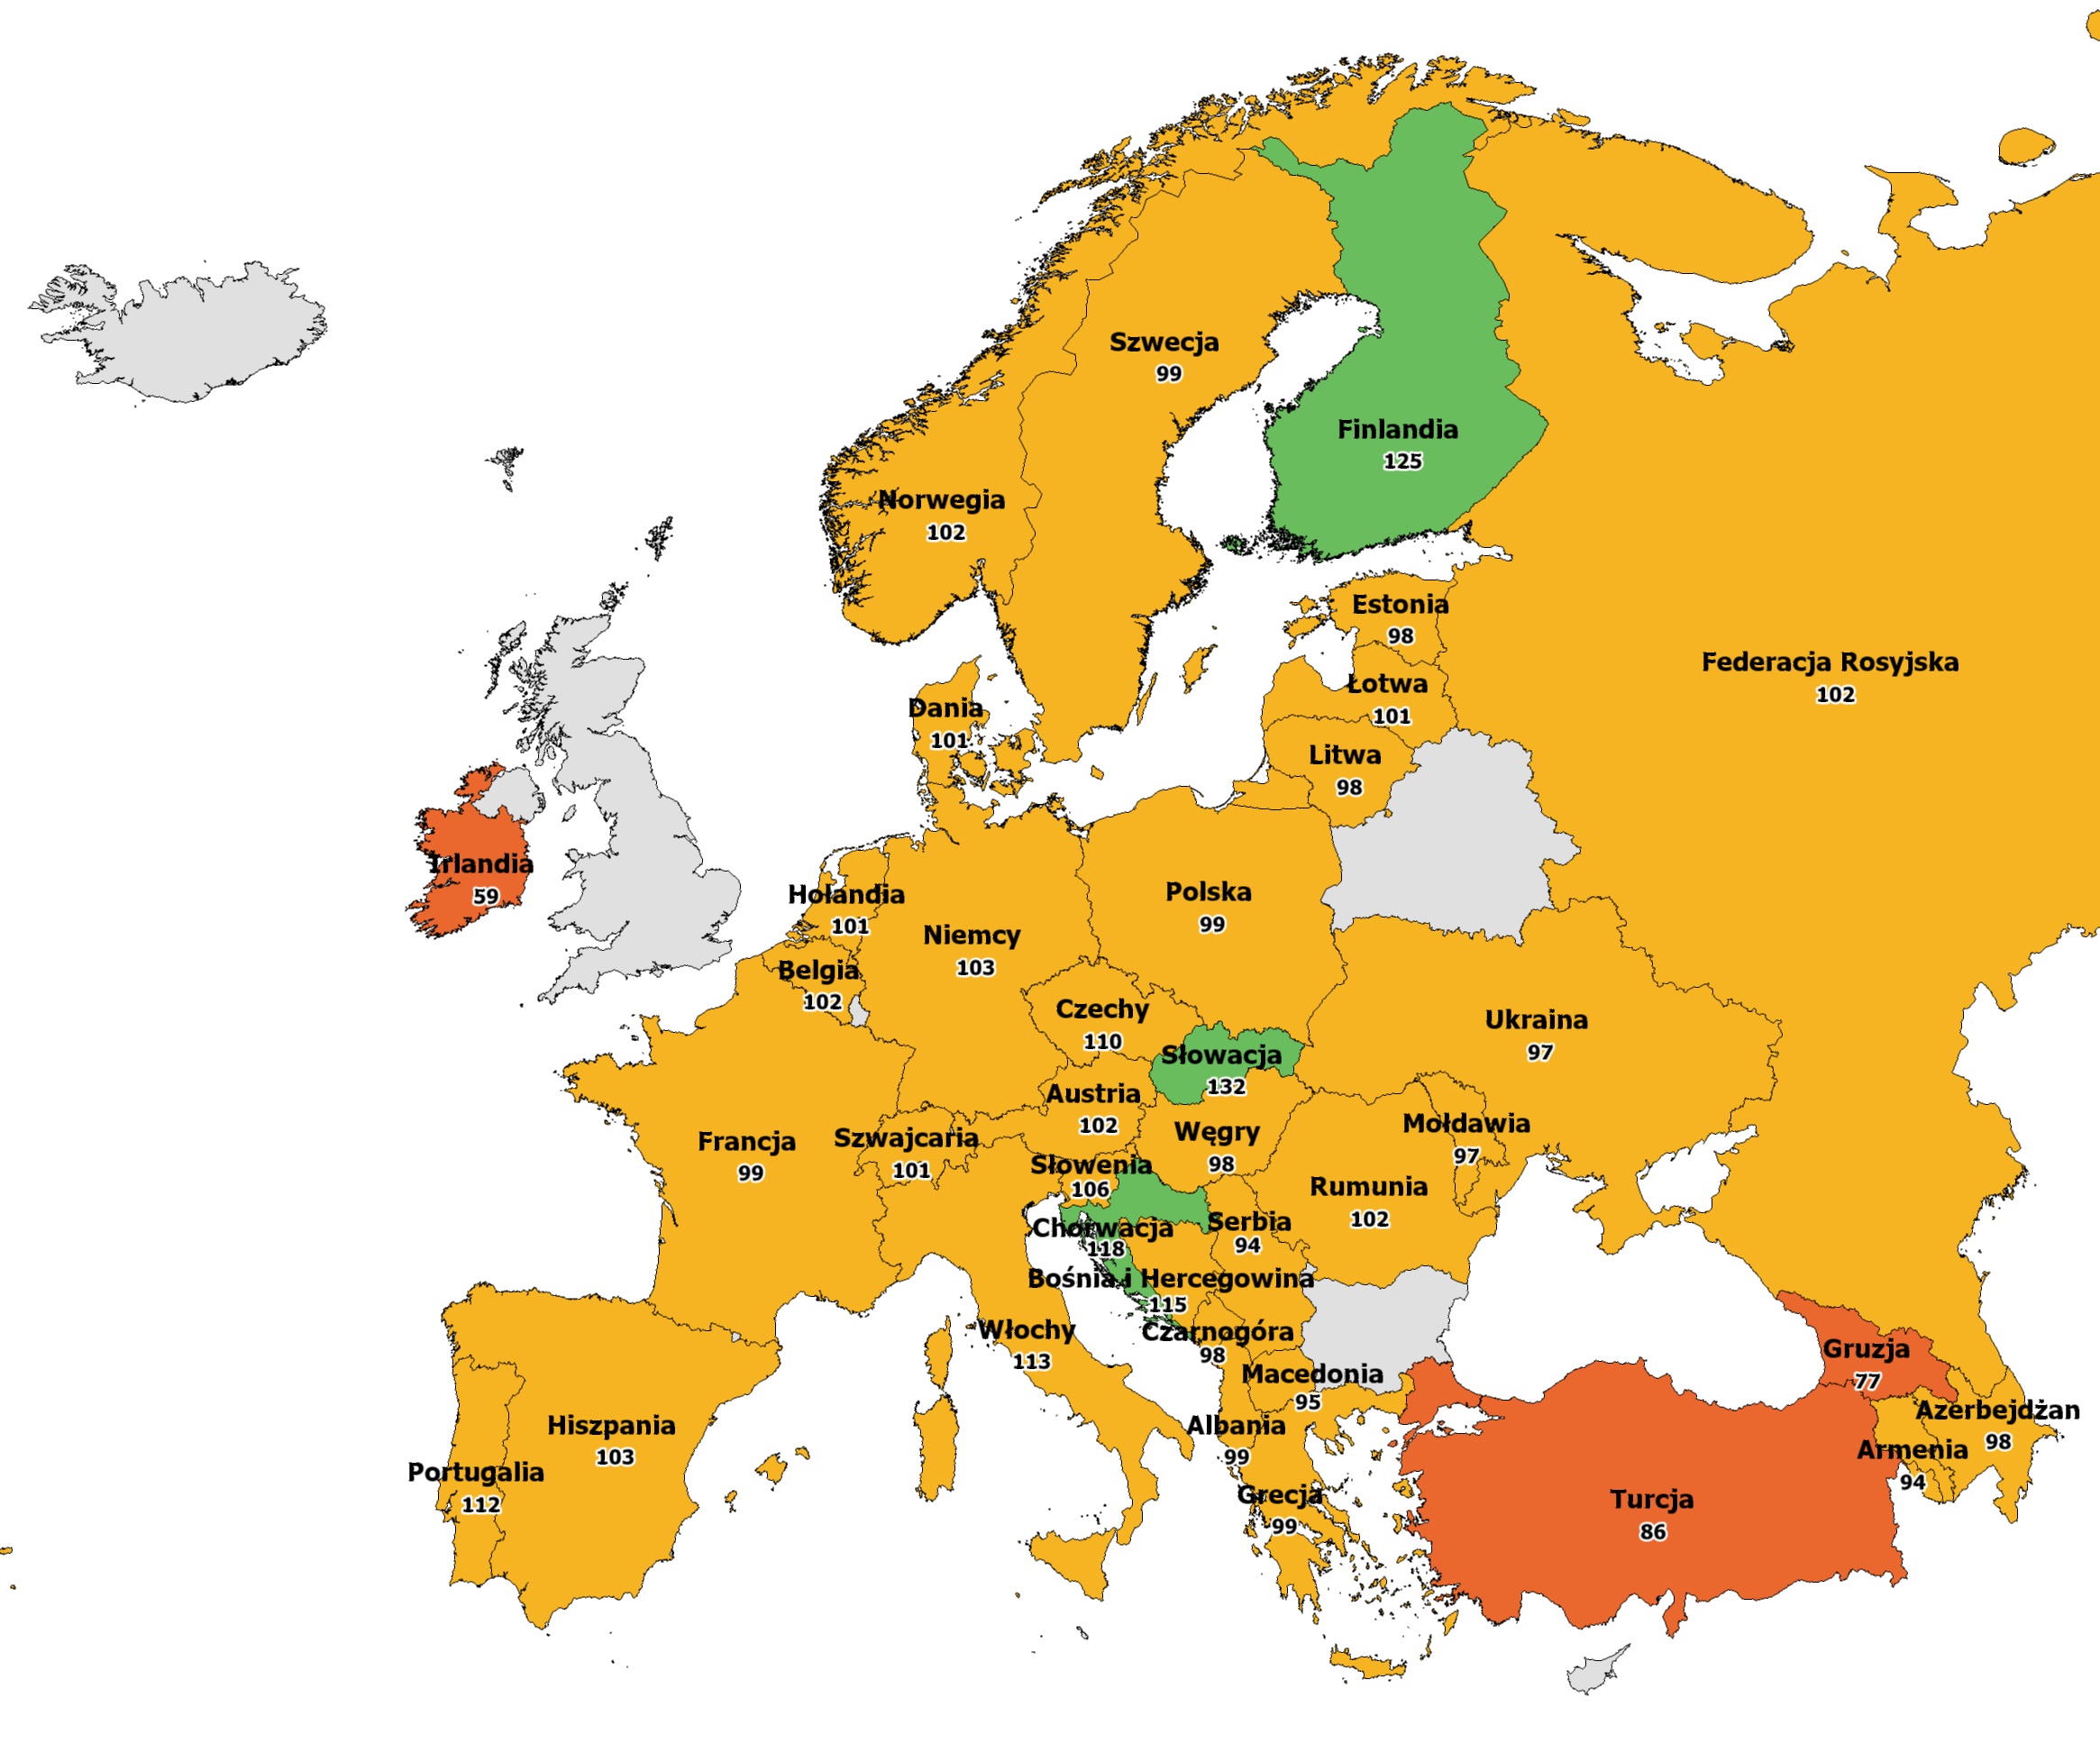
Źródło: CEPEJ Report on "European judicial systems - Edition 2018 (2016 data): efficiency and quality of justice" - Table 9.2 Clearance rate in civil and commercial litigious cases in first instance in 2016
| Pozycja | Kraj | Wartość |
| 1 | Słowacja | 132 |
| 2 | Finlandia | 125 |
| 3 | Chorwacja | 118 |
| 4 | Bośnia i Hercegowina | 115 |
| 5 | Włochy | 113 |
| 6 | Portugalia | 112 |
| 7 | Czechy | 110 |
| 8 | Słowenia | 106 |
| 9 | Niemcy | 103 |
| 10 | Hiszpania | 103 |
| 11 | Austria | 102 |
| 12 | Belgia | 102 |
| 13 | Norwegia | 102 |
| 14 | Rumunia | 102 |
| 15 | Federacja Rosyjska | 102 |
| 16 | Dania | 101 |
| 17 | Łotwa | 101 |
| 18 | Holandia | 101 |
| 19 | Szwajcaria | 101 |
| 20 | Albania | 99 |
| 21 | Francja | 99 |
| 22 | Grecja | 99 |
| 23 | Polska | 99 |
| 24 | Szwecja | 99 |
| 25 | Azerbejdżan | 98 |
| 26 | Estonia | 98 |
| 27 | Węgry | 98 |
| 28 | Litwa | 98 |
| 29 | Czarnogóra | 98 |
| 30 | Mołdawia | 97 |
| 31 | Ukraina | 97 |
| 32 | Macedonia | 95 |
| 33 | Armenia | 94 |
| 34 | Serbia | 94 |
| 35 | Turcja | 86 |
| 36 | Gruzja | 77 |
| 37 | Irlandia | 59 |
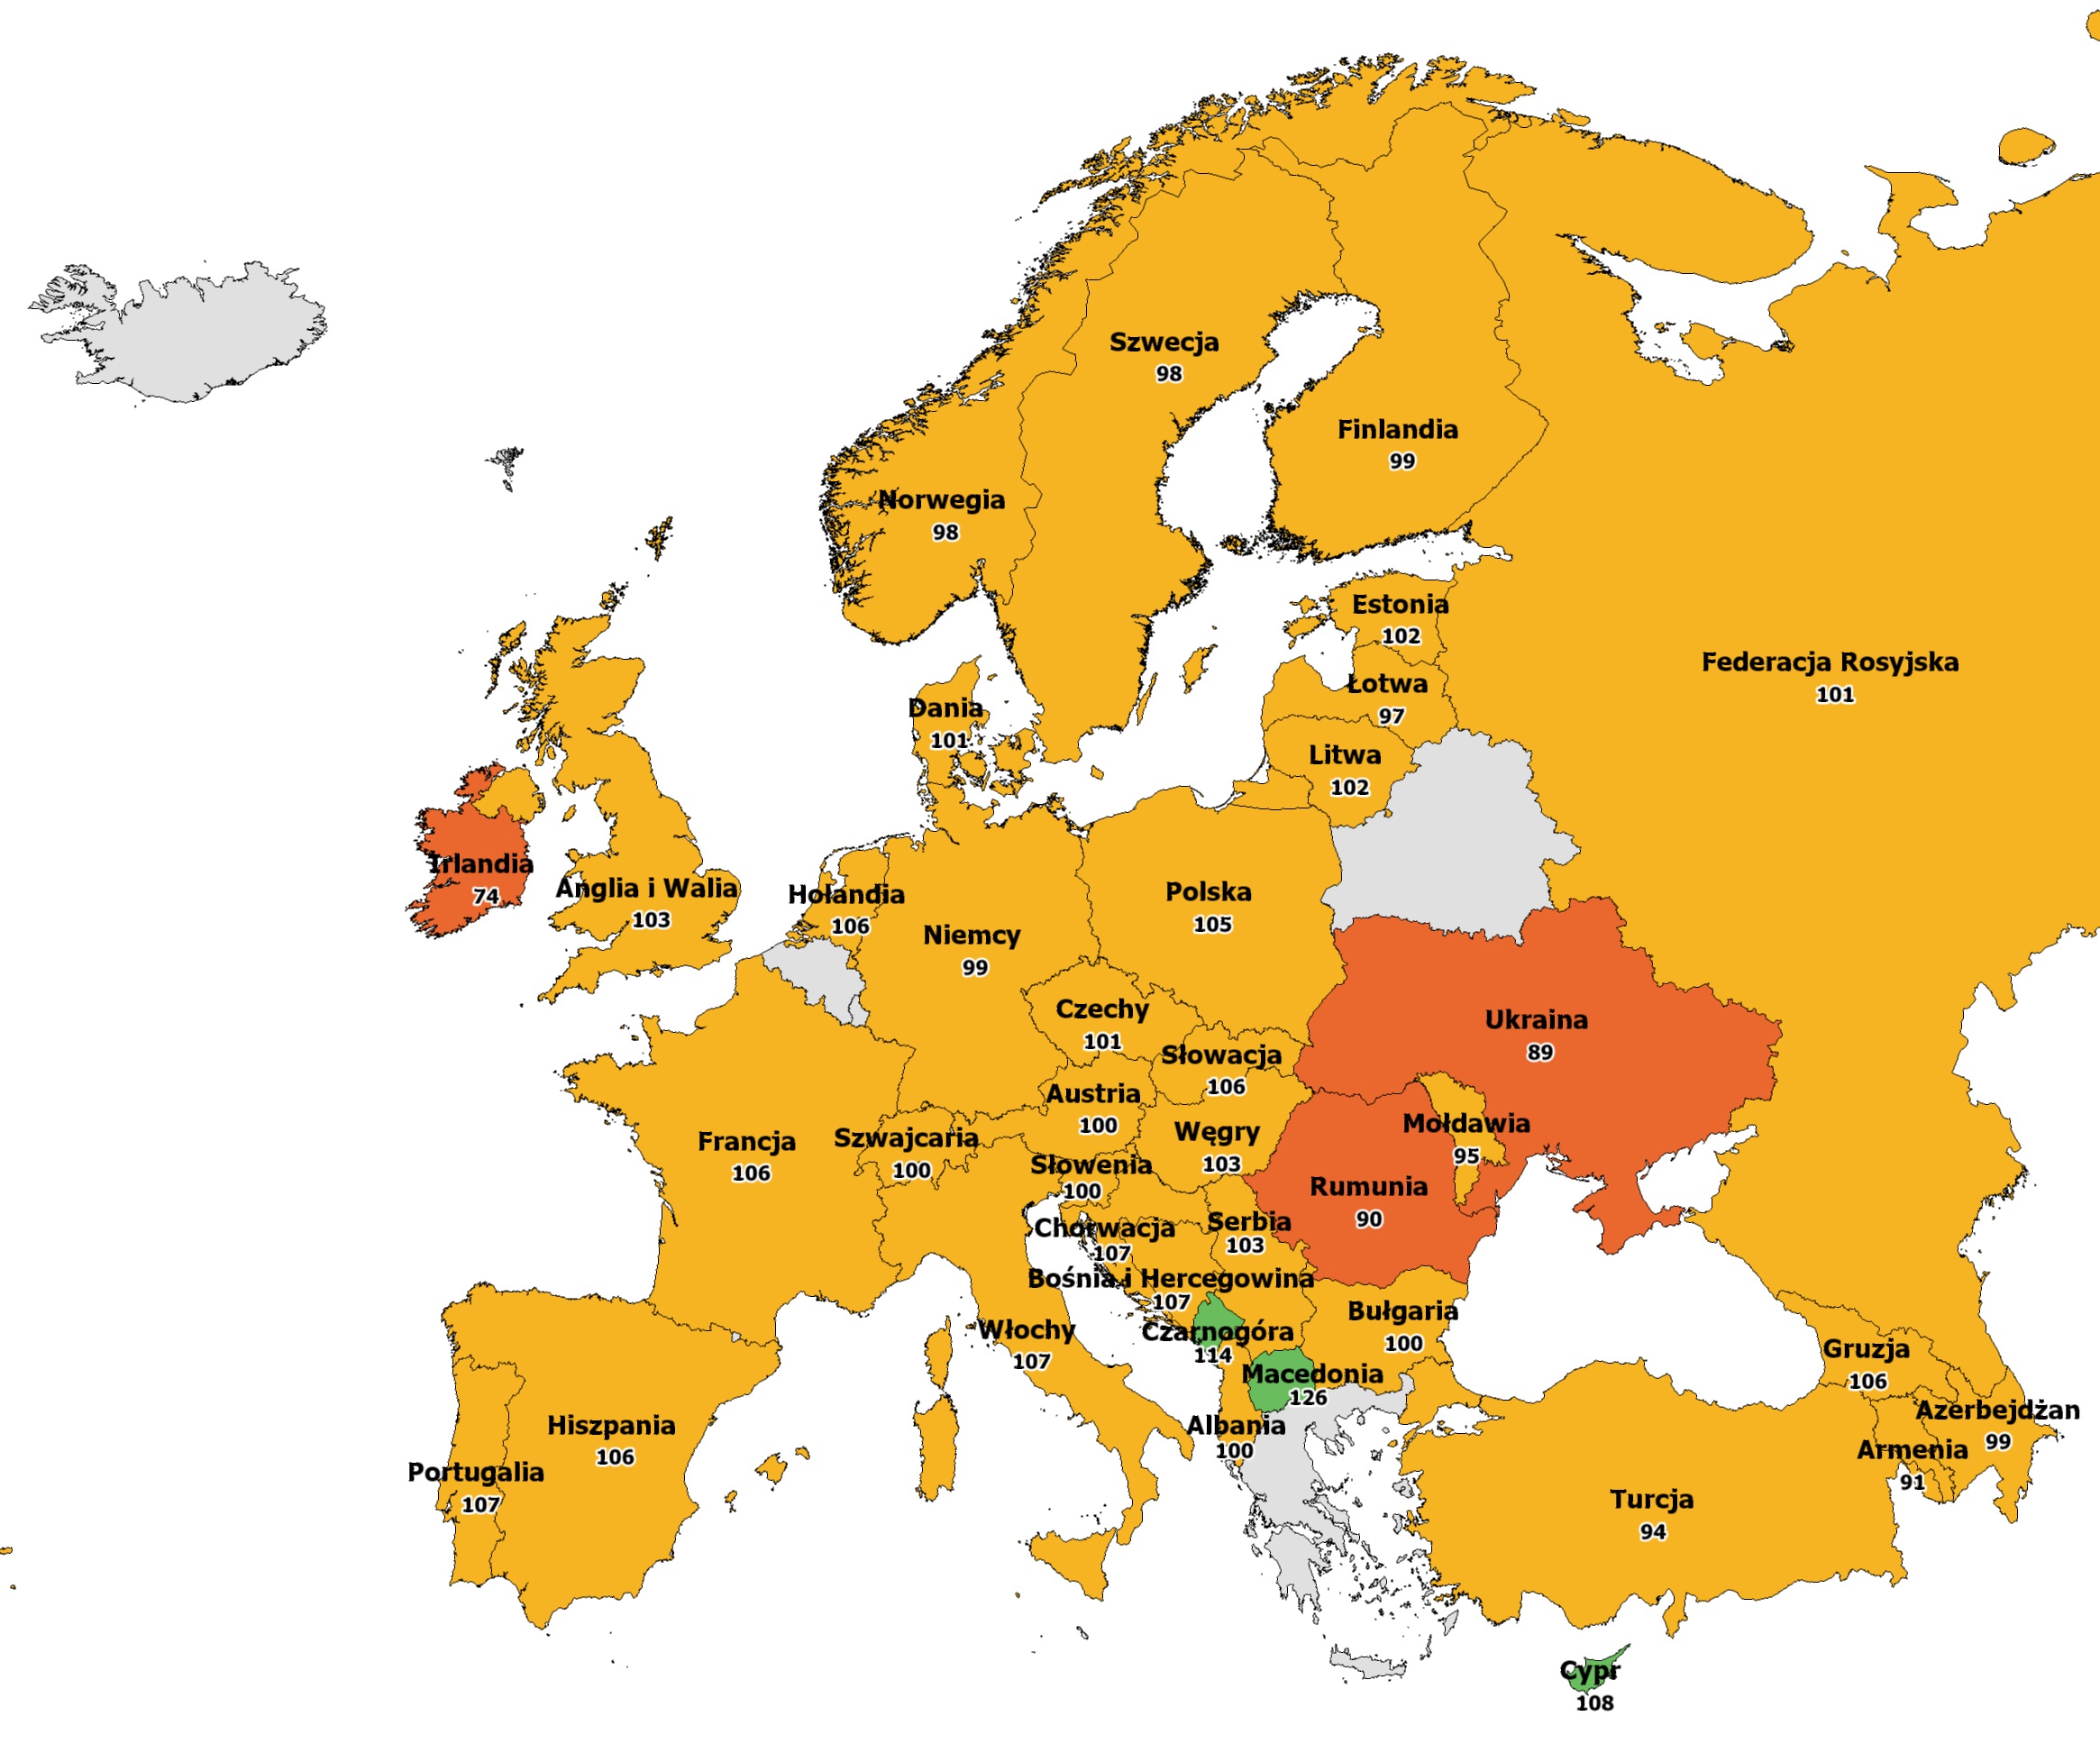
Źródło: CEPEJ Report on "European judicial systems - Edition 2018 (2016 data): efficiency and quality of justice" - Table 9.16 Clearance rate in criminal cases at first instance in 2016
| Pozycja | Kraj | Wartość |
| 1 | Macedonia | 126 |
| 2 | Czarnogóra | 114 |
| 3 | Cypr | 108 |
| 4 | Bośnia i Hercegowina | 107 |
| 5 | Chorwacja | 107 |
| 6 | Włochy | 107 |
| 7 | Portugalia | 107 |
| 8 | Francja | 106 |
| 9 | Gruzja | 106 |
| 10 | Holandia | 106 |
| 11 | Słowacja | 106 |
| 12 | Hiszpania | 106 |
| 13 | Polska | 105 |
| 14 | Węgry | 103 |
| 15 | Serbia | 103 |
| 16 | Anglia i Walia | 103 |
| 17 | Estonia | 102 |
| 18 | Litwa | 102 |
| 19 | Czechy | 101 |
| 20 | Dania | 101 |
| 21 | Federacja Rosyjska | 101 |
| 22 | Albania | 100 |
| 23 | Austria | 100 |
| 24 | Bułgaria | 100 |
| 25 | Słowenia | 100 |
| 26 | Szwajcaria | 100 |
| 27 | Azerbejdżan | 99 |
| 28 | Finlandia | 99 |
| 29 | Niemcy | 99 |
| 30 | Norwegia | 98 |
| 31 | Szwecja | 98 |
| 32 | Łotwa | 97 |
| 33 | Mołdawia | 95 |
| 34 | Turcja | 94 |
| 35 | Armenia | 91 |
| 36 | Rumunia | 90 |
| 37 | Ukraina | 89 |
| 38 | Irlandia | 74 |
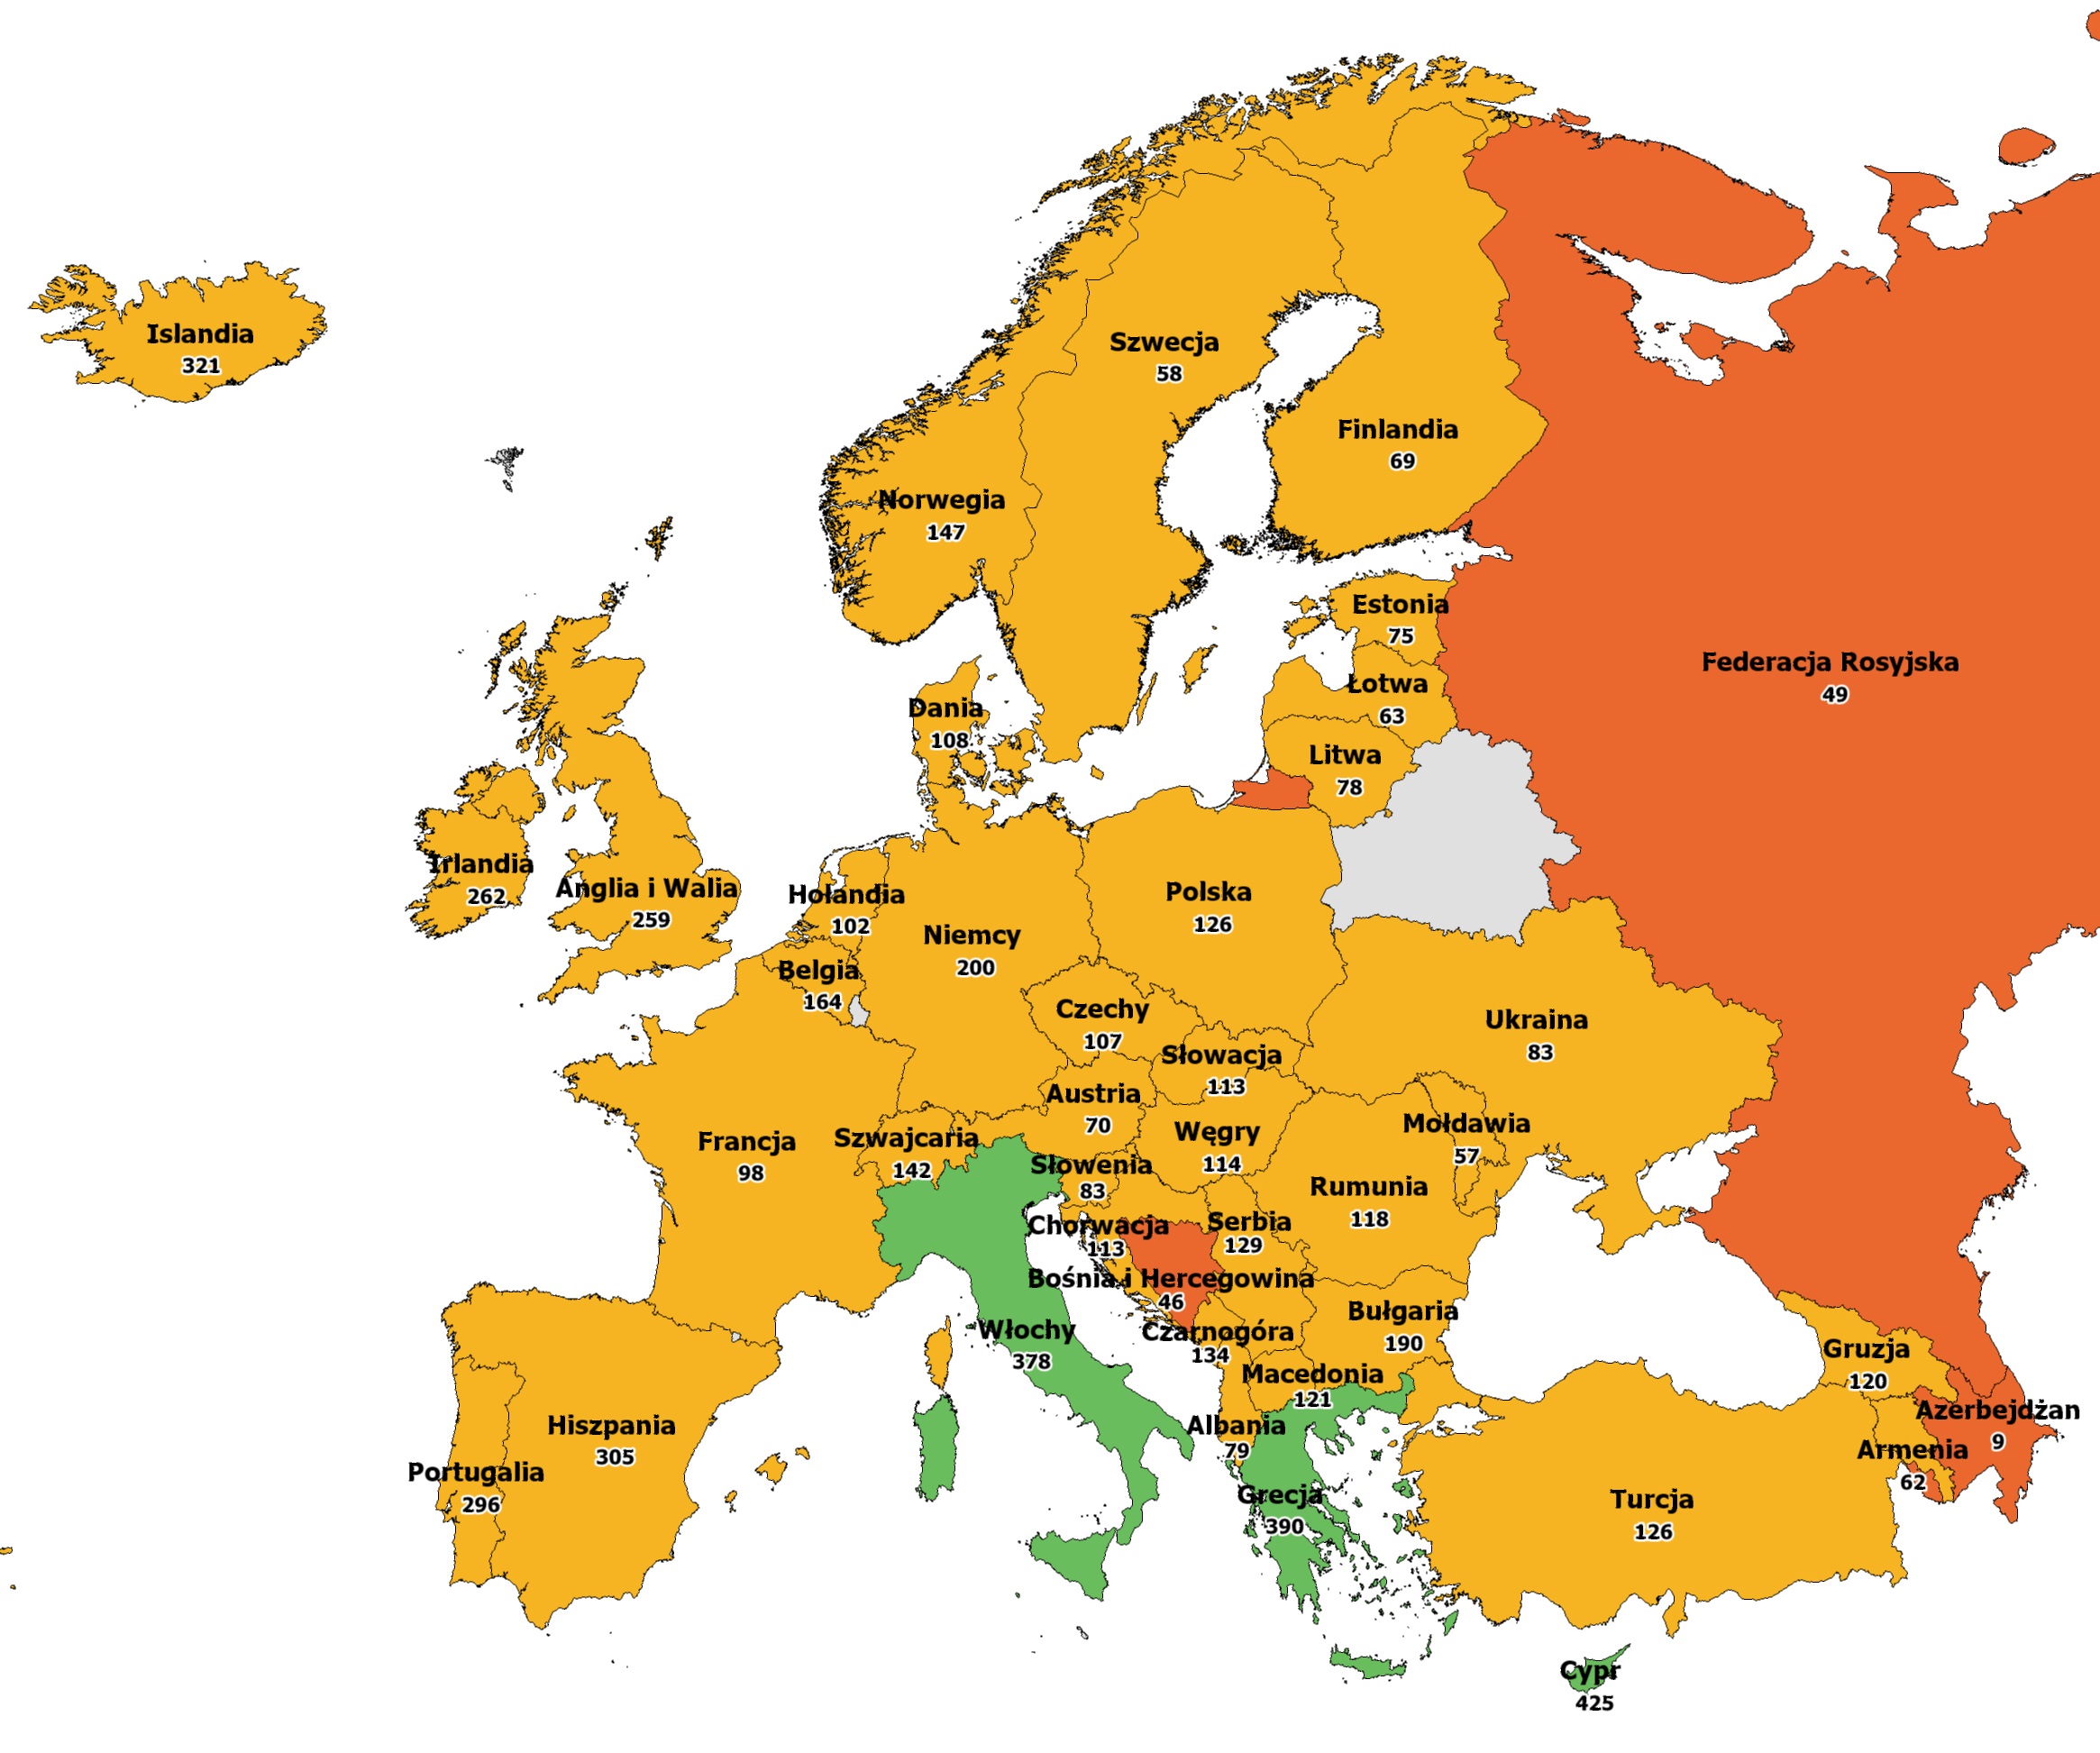
Źródło: CEPEJ Report on "European judicial systems - Edition 2018 (2016 data): efficiency and quality of justice" - Table 12.1 Number of practicing lawyer (without legal advisors) per 100 000 inhabitants in 2016
| Pozycja | Kraj | Wartość |
| 1 | Cypr | 425 |
| 2 | Grecja | 390 |
| 3 | Włochy | 378 |
| 4 | Islandia | 321 |
| 5 | Hiszpania | 305 |
| 6 | Portugalia | 296 |
| 7 | Irlandia | 262 |
| 8 | Anglia i Walia | 259 |
| 9 | Niemcy | 200 |
| 10 | Bułgaria | 190 |
| 11 | Belgia | 164 |
| 12 | Norwegia | 147 |
| 13 | Szwajcaria | 142 |
| 14 | Czarnogóra | 134 |
| 15 | Serbia | 129 |
| 16 | Polska | 126 |
| 17 | Turcja | 126 |
| 18 | Macedonia | 121 |
| 19 | Gruzja | 120 |
| 20 | Rumunia | 118 |
| 21 | Węgry | 114 |
| 22 | Chorwacja | 113 |
| 23 | Słowacja | 113 |
| 24 | Dania | 108 |
| 25 | Czechy | 107 |
| 26 | Holandia | 102 |
| 27 | Francja | 98 |
| 28 | Słowenia | 83 |
| 29 | Ukraina | 83 |
| 30 | Albania | 79 |
| 31 | Litwa | 78 |
| 32 | Estonia | 75 |
| 33 | Austria | 70 |
| 34 | Finlandia | 69 |
| 35 | Łotwa | 63 |
| 36 | Armenia | 62 |
| 37 | Szwecja | 58 |
| 38 | Mołdawia | 57 |
| 39 | Federacja Rosyjska | 49 |
| 40 | Bośnia i Hercegowina | 46 |
| 41 | Azerbejdżan | 9 |
 Porównania międzynarodowe /